AI Infrastructure Monitoring: Keep Models, Agents, and Workflows Reliable in Production
AI infrastructure monitoring connects telemetry, model usage, agent traces, quality checks, costs, and alerts to detect production failures.
On this page
AI infrastructure monitoring is the practice of continuously measuring the health, performance, cost, behavior, and security of AI systems after they are deployed. It covers the application that calls a model, the model provider, retrieval and tool systems, containers or serverless infrastructure, and the operational workflows that respond when something changes.
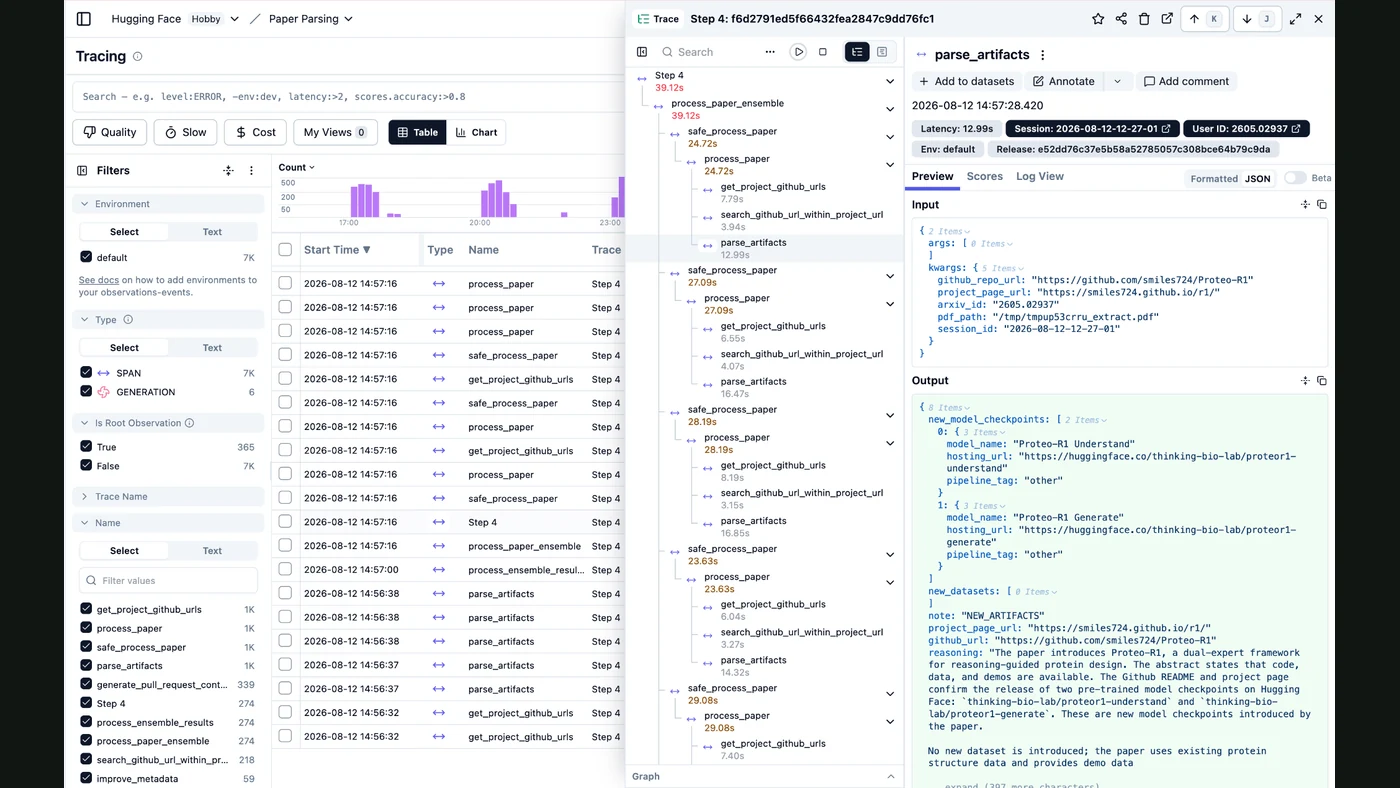
A recognizable example is a customer-support agent running in Kubernetes. Monitoring should show whether the request reached the service, how long each model and tool call took, how many input and output tokens were used, whether retrieval returned useful sources, whether the response met quality checks, and whether an alert requires an engineer or support manager to approve a change. OpenTelemetry provides common conventions for telemetry, while Kubernetes, Prometheus, and cloud monitoring services provide collection, storage, dashboards, and alerting. (opentelemetry.io)
Why AI infrastructure monitoring is different
Traditional application monitoring can often answer: Is the service up? Are requests failing? Is the database slow? AI systems need those signals plus questions about probabilistic behavior and variable consumption:
- Did the model return a valid response, or only an HTTP success code with unusable content?
- Did an agent call the correct tool, repeat a tool call, or enter a loop?
- Did retrieval return relevant and permitted information?
- Did a prompt, model version, context window, or provider change increase latency or cost?
- Did answer quality, refusal behavior, or safety performance deteriorate?
This means infrastructure monitoring should not be treated as a single dashboard. It is a connected operating system for detecting, diagnosing, and responding to failure.
What to monitor
A practical monitoring design uses several signal groups rather than one generic “AI health” score.
| Signal group | Examples | What it helps you decide |
|---|---|---|
| Infrastructure | CPU, memory, GPU utilization, pod restarts, queue depth, disk, network errors | Is the runtime capacity healthy? |
| Application | Request volume, success rate, timeout rate, exceptions, retries, throughput | Is the application serving requests correctly? |
| Model and provider | Model, provider, latency, rate limits, error codes, input tokens, output tokens | Is a model dependency slow, unavailable, or expensive? |
| Agent workflow | Tool calls, step count, loop detection, handoffs, failed actions, approval state | Is the agent following its intended process? |
| Retrieval and data | Retrieval latency, empty results, source coverage, permission failures, freshness | Is the system using the right context? |
| Quality and safety | Groundedness, relevance, refusal rate, policy violations, human feedback | Is the output still acceptable for the use case? |
| Business outcome | Escalation rate, task completion, conversion, resolution time, rework | Is the AI system producing useful operational results? |
OpenTelemetry defines common naming and structure for metrics, logs, traces, and resources. Its generative AI conventions are designed to capture details such as model calls, token usage, latency, and tool interactions, although some GenAI conventions remain under active development. Standardization matters because it lets teams correlate a slow user request with the exact model call, retrieval query, or downstream service that caused it. (opentelemetry.io)
A reference architecture for production monitoring
The monitoring stack usually has five layers:
- Instrumentation: Add OpenTelemetry SDKs or compatible integrations to the AI application, model client, tool adapters, queues, databases, and retrieval layer.
- Collection: Send metrics, logs, traces, and selected events to a collector or cloud-native telemetry pipeline.
- Storage and analysis: Store time-series metrics, searchable logs, distributed traces, and evaluation results in systems suited to their retention and query needs.
- Operations view: Build dashboards around services, environments, models, agents, customers, and workflow versions—not only around infrastructure hosts.
- Response: Route actionable alerts to the appropriate owner, create incident records, trigger safe remediation, or request approval for higher-impact changes.
Kubernetes describes observability through metrics, logs, and traces, and emphasizes correlating these signals to understand cluster and application behavior. That correlation is especially important for AI agents because one user request can produce multiple model calls, tool calls, database operations, and retries. (kubernetes.io)
The minimum viable dashboard
A first production dashboard should answer these questions without opening several disconnected tools:
- Are requests succeeding by application, environment, model, and workflow version?
- What are p50, p95, and p99 end-to-end latencies?
- Which dependency contributes most to slow requests?
- Are token usage and estimated spend rising unexpectedly?
- Are retries, rate-limit responses, or timeout errors increasing?
- Which agents have unusual step counts or tool-call patterns?
- Are quality evaluations or user feedback moving below an agreed threshold?
- Are alerts linked to traces, logs, runbooks, and the owner responsible for action?
Prometheus supports recording rules for precomputing commonly queried expressions and alerting rules for evaluating conditions over time. (prometheus.io, prometheus.io) Alertmanager handles deduplication, grouping, routing, silencing, inhibition, and delivery to configured receivers. (prometheus.io) This separation helps prevent a dashboard from becoming the only place where failures are visible.
How to set up AI infrastructure monitoring
1. Define service boundaries and owners
List each production AI application, agent, model provider, retrieval system, tool, data store, queue, and deployment environment. Assign an owner and a severity policy. A payment-related agent, for example, should have stricter escalation rules than an internal summarization tool.
2. Instrument the complete request path
Capture a trace from the incoming request through orchestration, model calls, retrieval, tool execution, retries, and final response. Use stable identifiers for application, environment, model, workflow version, tenant, and request class. Avoid placing raw prompts, responses, secrets, or regulated personal data into telemetry by default.
3. Establish operational thresholds
Start with thresholds that reflect the actual service contract: timeout rate, latency, queue age, provider errors, spend limits, and failed actions. For quality, define a small evaluation set or review process before attempting continuous automated scoring. A quality threshold without a defined test population is not an operational control.
4. Connect alerts to response
A useful alert includes the affected service, time window, likely cause, severity, owner, trace link, and next action. Examples include “model provider rate limit sustained for five minutes,” “agent exceeded normal tool-call count,” or “retrieval returned no permitted sources for a high-risk workflow.” Low-confidence alerts should create a review task rather than automatically changing production behavior.
5. Add controlled remediation
Safe automated actions may include restarting an unhealthy worker, pausing a queue consumer, switching to a pre-approved fallback model, lowering concurrency, or opening an incident. Actions that change prompts, access permissions, model versions, customer-facing policy, or spending limits should normally require approval.
Microsoft Foundry’s monitoring documentation illustrates this combined approach: its Application Insights-backed monitoring view brings token consumption, latency, exceptions, and response-quality signals into one operational view. The same design can be implemented with other cloud and open-source components. (learn.microsoft.com)
Limitations and failure modes
Monitoring does not automatically make an AI system correct. Common failure modes include:
- Instrumenting only the API server: This hides model, retrieval, and tool latency.
- Logging everything: Raw prompts and responses can create privacy, security, retention, and cost problems.
- Tracking infrastructure but not outcomes: A healthy cluster can still produce irrelevant or unsafe answers.
- Using unstable labels: High-cardinality labels such as full prompts, user IDs, or arbitrary tool arguments can make metrics expensive and difficult to query.
- Alerting on every anomaly: Teams begin ignoring alerts when normal model variability creates constant noise.
- Treating vendor dashboards as a complete system: A provider dashboard may not show your queue, application, retrieval, approval, or business outcome context.
- Assuming drift is measurable without a baseline: Quality or data drift requires a reference dataset, evaluation set, or defined operating range.
Cloud-native model monitoring products can help with particular model types, but their scope and availability vary. Amazon documents data quality, model quality, bias drift, and feature-attribution drift monitoring in SageMaker Model Monitor. It also states that new-customer access closed on July 30, 2026; existing customers can continue using the service, but AWS does not plan to introduce new features. That makes it relevant to existing deployments, not a generic recommendation for a new monitoring stack. Treat vendor services as components of a broader operating design, not universal substitutes for application observability. (docs.aws.amazon.com)
Cost drivers
The cost of monitoring is shaped less by the number of dashboards than by the volume and sensitivity of telemetry:
- request and trace volume;
- retention period for logs and traces;
- prompt and response capture, especially if content is stored;
- metric cardinality and query frequency;
- evaluation-model calls and human review;
- GPU, container, collector, and storage capacity;
- alert routing and incident-management integrations;
- cross-region or cross-cloud data transfer.
A sensible design samples low-value traces, keeps full traces for errors and selected workflows, aggregates routine metrics, redacts sensitive content, and stores detailed evaluation records only where they support a real decision. Retention and data-handling behavior must be verified for the actual provider, endpoint, feature, account eligibility, and configuration in use. OpenAI, for example, documents different default retention and data-control conditions across API capabilities. (platform.openai.com)
When AI infrastructure monitoring is worth implementing
It is a strong fit when an AI system is customer-facing, handles sensitive information, invokes tools, runs continuously, affects revenue or operations, or depends on several external providers. A lightweight internal experiment may need only structured logs and basic error tracking. A production agent fleet needs trace correlation, cost controls, quality checks, ownership, and an escalation path.
Use the following decision map:
Does the AI system affect customers, money, sensitive data, or operational decisions?
→ No: begin with structured logs, request metrics, and deployment health checks.
→ Yes: add distributed traces, model and tool telemetry, quality evaluations, cost alerts, and documented approval controls.
→ Does it take actions automatically? Add idempotency checks, action logs, rollback paths, and human approval for high-impact changes.
What FollowAI can build
FollowAI can design, code, connect, launch, operate, monitor, and improve a complete AI infrastructure operations system around your existing applications. That can include:
- OpenTelemetry instrumentation across AI applications, agents, model providers, retrieval, tools, queues, databases, and cloud infrastructure;
- centralized dashboards for latency, errors, tokens, estimated cost, retries, quality signals, and business outcomes;
- Prometheus-compatible metrics and alert rules with routing to Slack, email, PagerDuty, or your incident system;
- trace-linked runbooks that explain what an operator should inspect and which actions are safe;
- automated checks for runaway agent loops, abnormal spend, provider failures, queue backlogs, and unhealthy workers;
- approval workflows for model changes, prompt releases, access changes, fallback activation, and other high-impact operations;
- retention, redaction, access-control, and telemetry sampling policies aligned with the data handled by the system;
- ongoing monitoring and improvement of alert quality, dashboard usefulness, instrumentation coverage, and remediation workflows.
The result is one connected operating system rather than separate coordination between infrastructure engineers, AI developers, cloud administrators, and automation contractors. Continuous steps can run without intervention—telemetry collection, aggregation, threshold checks, anomaly detection, incident creation, and safe worker remediation—while sensitive data access, production model changes, customer-impacting policy changes, and high-risk actions remain subject to the approval rules you define.
For a company moving an AI agent or model-backed workflow into production, the natural deliverable is a deployed monitoring and response system connected to the real application—not a generic dashboard or a standalone assessment.
Continue through the Knowledge architecture
- Custom CRM Development for Real Business Processes
- AI Observability Dashboard
- Automated Backup And Recovery
Sources
- OpenTelemetry Semantic ConventionsOfficial documentation
- OpenTelemetry Generative AI ObservabilityPrimary source
- Kubernetes ObservabilityOfficial documentation
- Prometheus recording rulesOfficial documentation
- Prometheus alerting rulesOfficial documentation
- Prometheus AlertmanagerOfficial documentation
- Microsoft Foundry Generative AI MonitoringOfficial documentation
- Amazon SageMaker Model MonitorOfficial documentation
- OpenAI Platform Data ControlsOfficial documentation