AI Observability Dashboard
An AI observability dashboard connects traces, model usage, workflow metrics, evaluations, alerts, and ownership across deployed AI systems.
On this page
An AI observability dashboard is a connected monitoring system for seeing how models, agents, retrieval, tools, and business workflows behave in production. It combines technical telemetry—such as traces, metrics, and logs—with AI-specific signals such as token usage, model cost, evaluation scores, tool failures, retrieval quality, and human feedback.
A recognizable example is an agent that answers customer questions, searches a knowledge base, calls an order-status API, and escalates uncertain cases. Traditional uptime monitoring may show that the API returned 200 OK. An AI observability dashboard can show that the agent selected the wrong tool, retrieved irrelevant documents, exceeded its latency budget, or produced an answer that users repeatedly rejected.
What an AI observability dashboard is used for
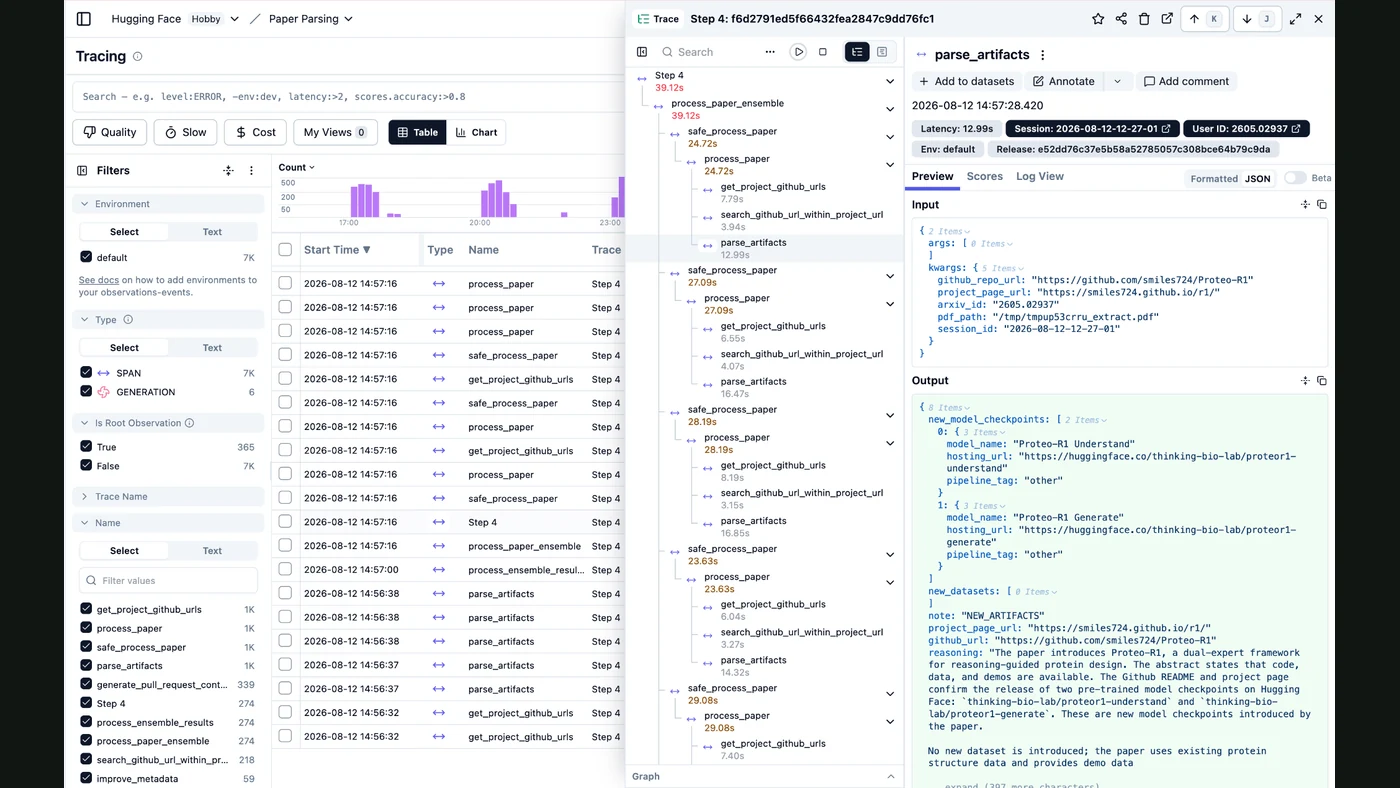
AI systems are not single requests. A production run can contain a router decision, several model generations, retrieval calls, database queries, external APIs, tool executions, retries, and approval checkpoints. An observability dashboard links these steps into a trace so an operator can investigate the complete run rather than inspect disconnected logs.
OpenTelemetry provides vendor-neutral APIs, SDKs, and collectors for traces, metrics, and logs. Its Collector can receive, process, filter, enrich, and export telemetry to one or more backends. (opentelemetry.io) AI-focused platforms such as Langfuse and Arize Phoenix add concepts for generations, tool calls, retrieval, sessions, evaluations, prompts, costs, and quality feedback. (langfuse.com)
The signals a useful dashboard should combine
| Signal | What it tells you | Example dashboard view |
|---|---|---|
| Traces and spans | What happened in one request or agent run | Model → retriever → tool → response timeline |
| Metrics | Whether behavior is changing over time | Error rate, p95 latency, throughput, escalation rate |
| Logs | Detailed events and diagnostic context | Provider errors, workflow exceptions, deployment events |
| Usage and cost | Which models, users, or features consume resources | Cost by model, workflow, tenant, or prompt version |
| Evaluations | Whether outputs meet a defined quality standard | Grounding, relevance, correctness, safety, or policy scores |
| Feedback | What users and reviewers report | Thumbs-down rate, corrected answers, support escalations |
A dashboard is not useful merely because it contains many charts. It should connect a top-level symptom to a trace, a trace to an owner, and an owner to a permitted response. For example, a rise in tool failures should open the affected workflow, identify the failing integration, and route an incident to the person who can change credentials, schema handling, or retry logic.
A practical AI observability architecture
<div class="fa-architecture" role="img" aria-label="AI observability architecture">
  <div class="fa-layer"><strong>AI applications</strong><span>Agents · RAG · copilots · automations</span></div>
  <div class="fa-arrow">↓ traces, metrics, logs, feedback, evaluations</div>
  <div class="fa-layer"><strong>Instrumentation</strong><span>OpenTelemetry · provider SDKs · workflow events</span></div>
  <div class="fa-arrow">↓ filter, redact, batch, sample, enrich</div>
  <div class="fa-layer"><strong>Telemetry pipeline</strong><span>OpenTelemetry Collector · queues · policy controls</span></div>
  <div class="fa-arrow">↓ export and correlate</div>
  <div class="fa-layer"><strong>Dashboard and response</strong><span>Traces · metrics · alerts · evaluations · tickets · approvals</span></div>
</div>
The first design decision is instrumentation. Capture the boundaries that explain business behavior: the root request, agent or workflow step, model generation, retrieval operation, tool call, external API request, approval, and final outcome. Langfuse recommends representing model calls as generations and actions as tools, with meaningful nesting so the trace shows which component owns each step. (langfuse.com)
The second decision is context. Add stable attributes such as environment, application, workflow name, release, model, prompt version, tenant, user or account identifier, and outcome. Avoid placing unrestricted personal or confidential data into telemetry. Redaction and access controls belong in the collection pipeline and dashboard design, not as an afterthought.
The third decision is storage and sampling. Sampling reduces telemetry volume, but careless sampling can remove the very traces needed to investigate failures. OpenTelemetry distinguishes head sampling, which decides early, from tail sampling, which can retain traces based on completed-trace properties such as errors or latency. (opentelemetry.io) A sensible policy may retain all errors and high-latency traces, keep a representative sample of successful traffic, and capture more data temporarily during a controlled investigation.
Core dashboard panels
A production dashboard normally needs several layers rather than one crowded screen:
- Service health: request volume, success and error rates, latency percentiles, queue depth, and provider availability.
- Agent behavior: tool-selection errors, loop detection, retries, abandoned runs, escalation rate, and approval wait time.
- Model operations: model and prompt versions, token usage, cost, rate limits, context size, and fallback frequency.
- Retrieval quality: retrieval latency, empty results, document-source distribution, citation or grounding checks, and evaluator scores.
- Business outcomes: completed tasks, handoffs, booking or resolution outcomes, user feedback, and workflow conversion events.
- Incident response: active alerts, affected releases, owners, runbooks, and links to representative traces.
Langfuse documents dashboards that break down cost, latency, quality, and volume by dimensions such as user, session, feature, model, prompt version, and release. Its usage model also illustrates a central cost driver for hosted observability: ingested traces, observations, and scores. (langfuse.com)
| Dashboard requirement | Implementation check |
|---|---|
| Trace-to-metric correlation | Every alert links to representative traces and preserves trace context in logs. |
| AI-specific cost visibility | Model name, input/output usage, cached usage where relevant, and pricing version are recorded. |
| Quality monitoring | Deterministic checks, model-based evaluations, or human review produce named scores. |
| Privacy controls | Sensitive inputs and outputs are redacted, access-controlled, or excluded before export. |
| Actionable ownership | Each alert has a severity, owner, runbook, and escalation path. |
Setup sequence
1. Define the failure and ownership model
Start with the decisions the dashboard must support: roll back a release, disable a tool, switch a model, pause an automation, request approval, or open an incident. Assign an owner to every critical workflow and define which actions require human approval.
2. Instrument the critical paths
Begin with one production workflow, not every service. Add tracing around the agent entry point, model calls, retrieval, tools, external APIs, retries, and final outcome. Use OpenTelemetry where possible and add provider- or framework-specific instrumentation where it captures AI attributes more accurately.
3. Normalize telemetry
Use stable names for workflows, tools, models, prompts, environments, and releases. Route data through an OpenTelemetry Collector when you need batching, retries, encryption, filtering, or sensitive-data handling. (opentelemetry.io)
4. Add quality and business events
A successful HTTP response is not proof of a successful AI outcome. Record events such as answer accepted, answer corrected, task completed, escalation required, appointment booked, or human override. Add deterministic checks where possible and model-based or human evaluations where judgment is required. Phoenix documents code-based evaluators, LLM-as-a-judge evaluations, and human annotations as complementary methods. (arize.com)
5. Create alert rules with restraint
Alert on conditions that require action: sustained provider errors, abnormal latency, runaway cost, repeated tool failures, quality regression, missing telemetry, or unsafe-policy matches. Do not alert on every failed model call if the workflow already has a safe retry or fallback path. Alert fatigue is itself an observability failure.
Cost drivers and limitations
An AI observability dashboard has both platform cost and operating cost. The main drivers are telemetry volume, retention period, storage and query capacity, number of environments, high-cardinality attributes, evaluation calls, dashboard refresh frequency, and the operational work required to maintain instrumentation. Token and cost tracking also depends on accurate model names and usage data; Langfuse notes that costs can be ingested directly or inferred from model pricing definitions. (langfuse.com)
The most important limitation is that observability cannot repair an unmeasurable workflow. If the application does not emit stable identifiers, outcome events, prompt versions, or tool boundaries, the dashboard may display attractive infrastructure charts without explaining business failures. Sampling can hide rare events, evaluations can be noisy or biased, and storing raw prompts or outputs can create privacy and security exposure.
A dashboard also does not replace access control, testing, incident response, model governance, or application reliability engineering. It is the evidence layer that connects those practices. For the broader reliability operating model, see AI Infrastructure Monitoring and Automated Backup and Recovery. For agent construction and workflow boundaries, see AI Agents vs Workflows. For permissions and approval design, see AI Access Control.
When an AI observability dashboard is suitable
Choose this approach when you operate AI workflows that are customer-facing, revenue-related, connected to sensitive systems, or difficult to debug from ordinary application logs. It is especially valuable when several models, tools, retrieval sources, environments, or human approvals participate in one run.
A lightweight implementation may be enough for an internal prototype: structured logs, a small trace store, basic latency and error metrics, and manual review. A production system needs stronger controls around retention, redaction, sampling, alert ownership, evaluation design, access management, and recovery when telemetry itself is unavailable.
What FollowAI can build
FollowAI can design, code, connect, launch, operate, monitor, and improve an AI observability system around your actual workflows. The deliverable can include:
- OpenTelemetry instrumentation for agents, model calls, retrieval, tools, APIs, queues, and approval steps.
- A managed telemetry pipeline with batching, retries, filtering, redaction, sampling, and environment separation.
- A dashboard spanning runtime health, agent behavior, model usage, cost, evaluation scores, user feedback, and business outcomes.
- Connections to your cloud platform, model providers, data stores, ticketing system, alerting channels, CRM, and deployment pipeline.
- Continuous alerts that create incidents, assign owners, attach representative traces, and escalate according to severity.
- Optional automated responses, such as disabling a failing tool or routing traffic to a fallback, with required human approval for high-impact changes.
- Runbooks, retention policies, access controls, evaluation schedules, and ongoing dashboard and instrumentation maintenance.
This creates one connected operating system for AI reliability instead of making separate developers, infrastructure engineers, CRM integrators, and automation contractors coordinate each telemetry source and response path independently. The right build depends on your workflows, data sensitivity, deployment model, and required approval boundaries, so implementation should begin with a scoped architecture and a defined incident contract—not with a wall of generic charts.
Continue through the Knowledge architecture
- Custom CRM Development for Real Business Processes
- AI Infrastructure Monitoring: Production Observability
- LLM Cost Optimization: Control Token Spend in Production
Want FollowAI to build this for your business?
Tell us what is already running, where it is hosted, and which reliability, security, or cost problems need attention.
Describe your goal in our project assistant. It will clarify the result and the service you want, then offer a project discussion with the FollowAI team.
Discuss my projectShare contact details when you want the team to follow up. Scope and pricing are confirmed by the team.
Or email hello@followai.proChat with the team on WhatsAppSources
- OpenTelemetryOfficial documentation
- OpenTelemetry CollectorOfficial documentation
- OpenTelemetry SamplingOfficial documentation
- OpenTelemetry Collector ProcessorsOfficial documentation
- Langfuse Observability Best PracticesOfficial documentation
- Langfuse MetricsOfficial documentation
- Langfuse Token and Cost TrackingOfficial documentation
- Langfuse Billable UnitsOfficial documentation
- Arize PhoenixOfficial documentation
- Arize Phoenix Tracing TutorialOfficial documentation